I make complex tools and ideas feel clear, useful and human.
Name
Christopher Morales
Role
Lead UX/UI Designer
Company
Infodat Inc.
Focus
Data and AI products
I'm a product and UX designer who makes complex data and AI products feel simple. At Infodat I lead design for data tools end to end, from user research and information architecture through to shipped, high-fidelity UI.
My work spans product, growth and marketing: interface design, design systems, landing pages, marketing funnels and brand.
An AI-powered ETL and data intelligence platform that lets people load, transform and question their data in plain language.
Role
Lead Product & UX Designer
Team
Lean product and engineering team
Year
2025
Scope
Research, IA, interaction, UI, brand, design system
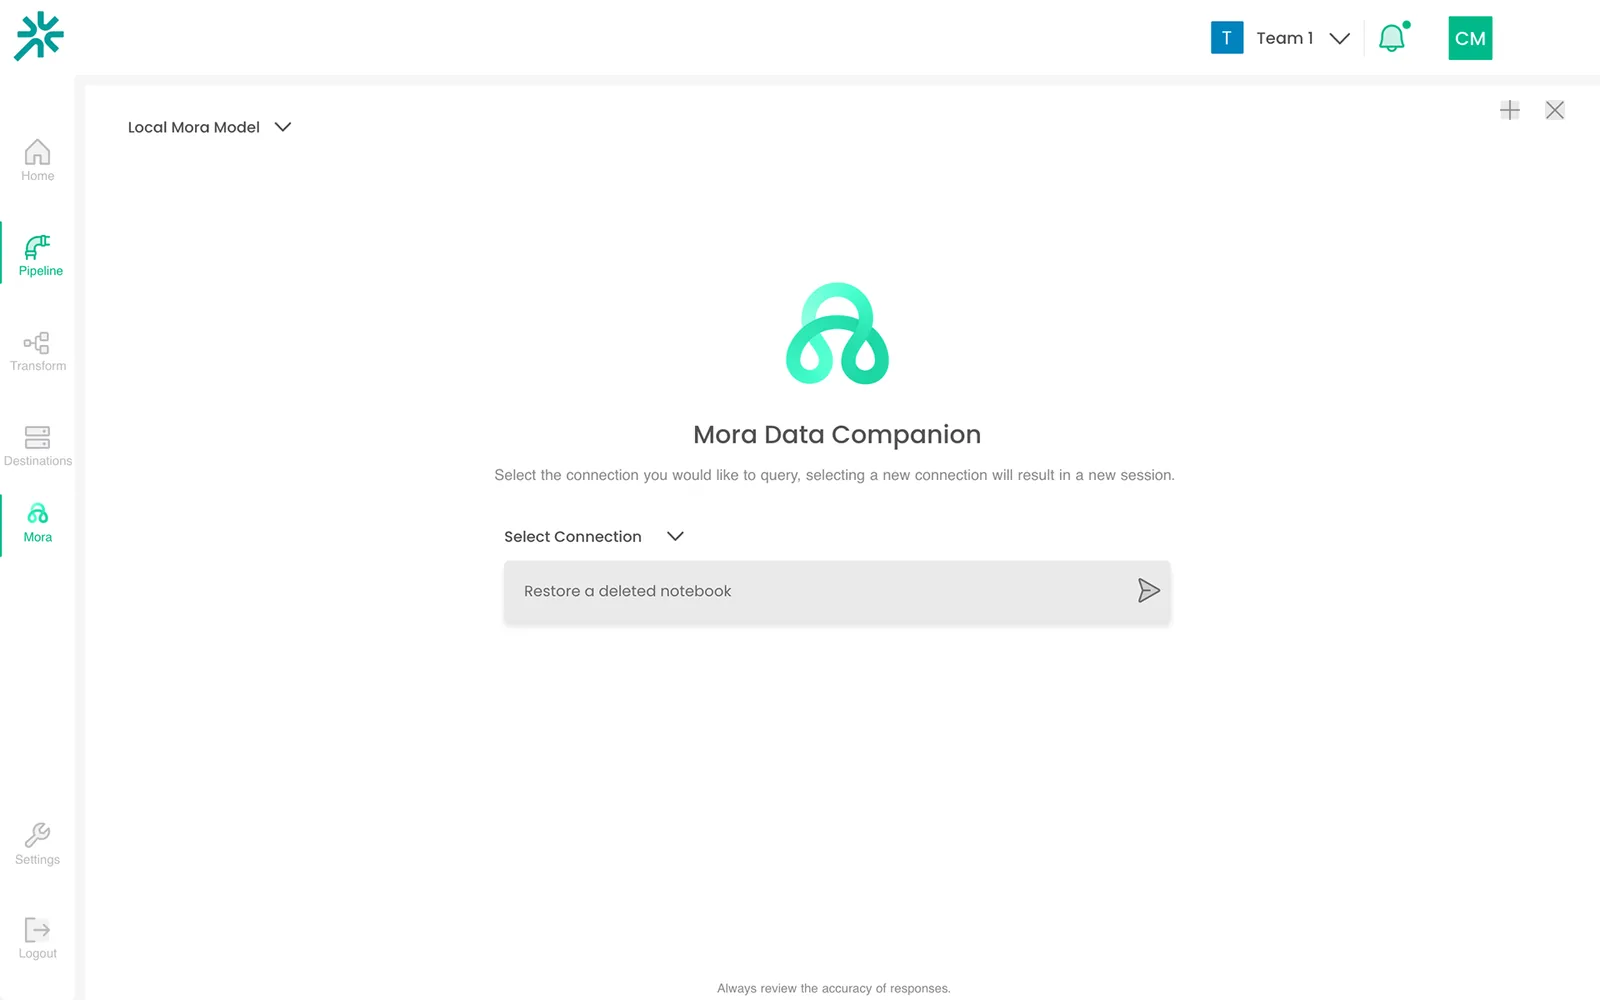
Mora, the AI data assistant: pick a connection and ask a question in plain language.
The problem
Most data work assumes technical skill: writing SQL, wiring pipelines, knowing how the data is shaped. That locks out the analysts, operations leads and business users who actually hold the questions. Morphus lets them load, transform and explore data without ever querying a database.
What I designed
Plain-language chat
Ask questions of your data and get answers and charts back, each one traceable to its source.
Visual pipeline builder
A node-based flow for loading and transforming data, with real-time feedback so errors show up while you build.
First-run experience
A tutorial-style onboarding where new users build and run their first pipeline. Experienced users can skip it.
Brand and design system
The component library, type and color tokens, and layout patterns the product is built on.
User flow highlights
Simplified data loadingA streamlined file import with clear instructions.
Transformation workflowThe pipeline builder makes every transformation step visible and editable.
Real-time feedbackResults update as you go, so mistakes are caught before a run fails.
Custom workspacesGroup projects into workspaces to keep work organized.
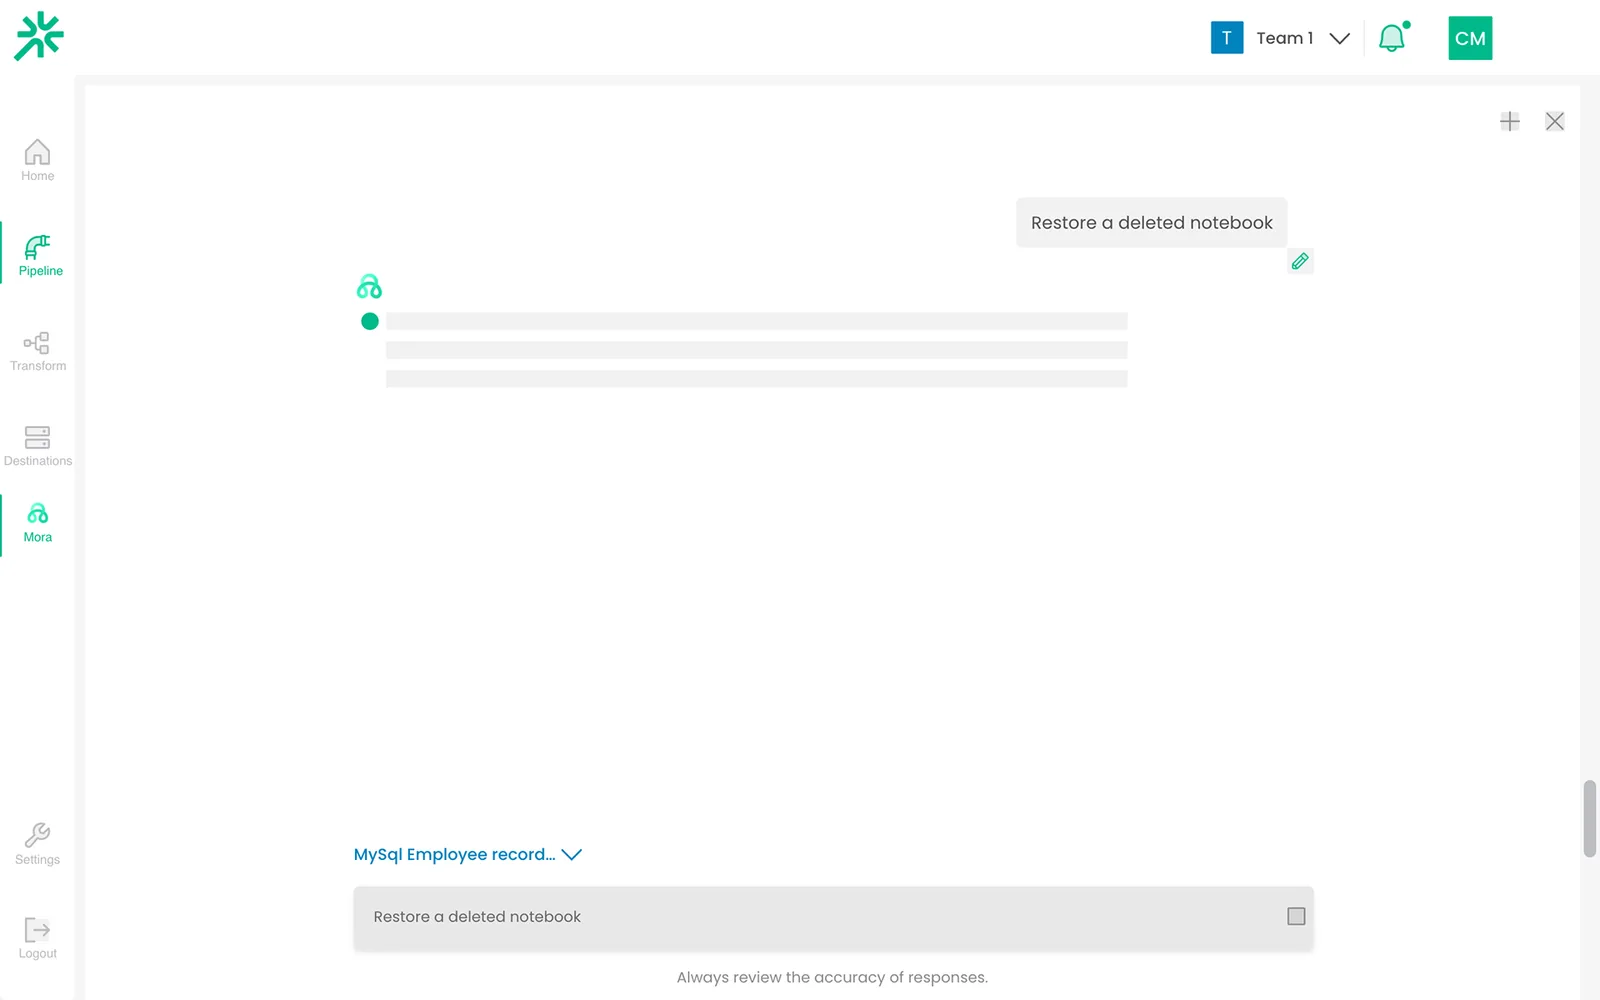
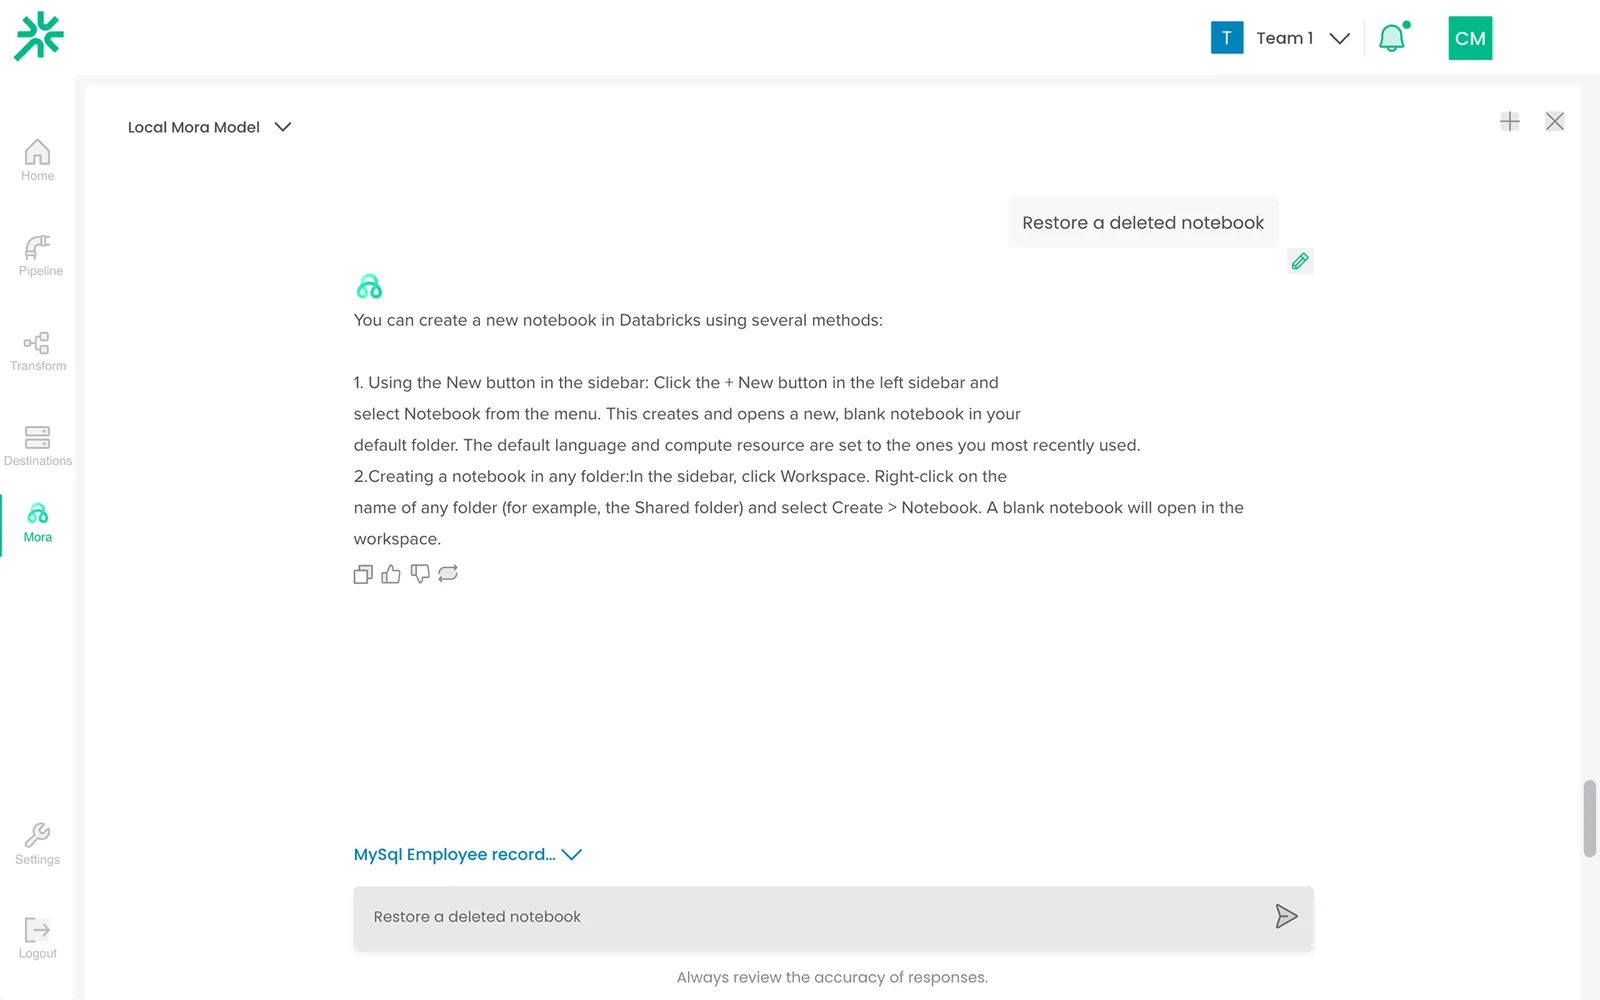
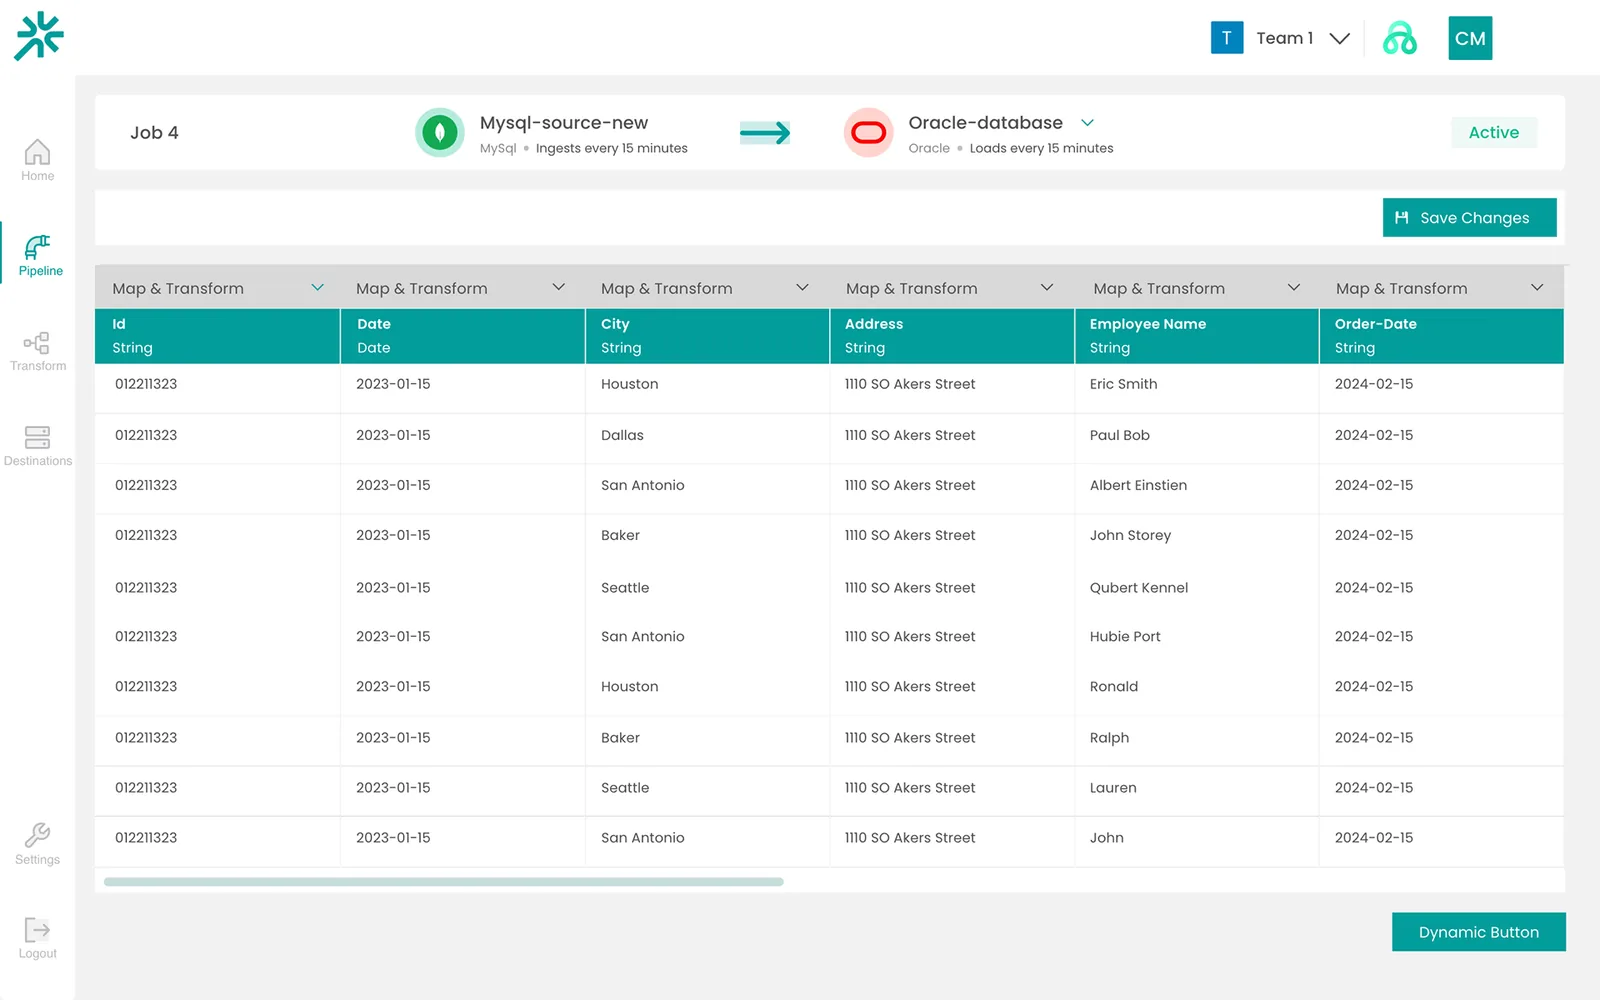
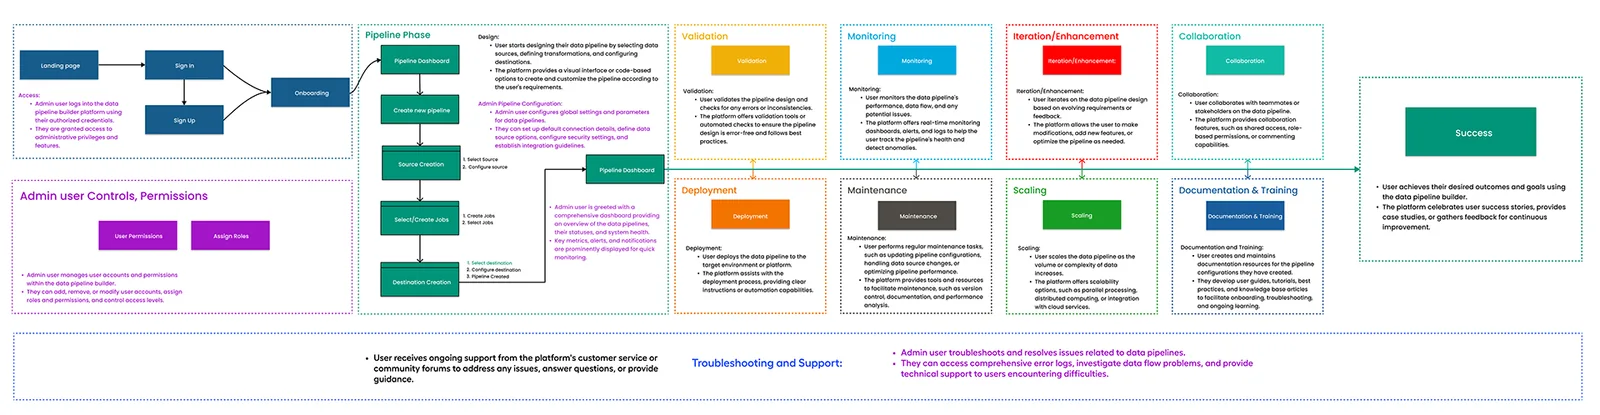
Skeleton screens while the assistant works on an answer.A step-by-step answer, with feedback controls and the source connection shown.A pipeline job mapping a MySQL source to an Oracle destination, with every field visible before you run it.The end-to-end user flow I mapped for loading, transforming and querying data.
Chris Morales / Akeepo
Akeepo Design Systems
A brand identity and design system for Akeepo, an early-stage technology and consulting company.
Role
Lead Designer
Client
Akeepo
Year
2024
Scope
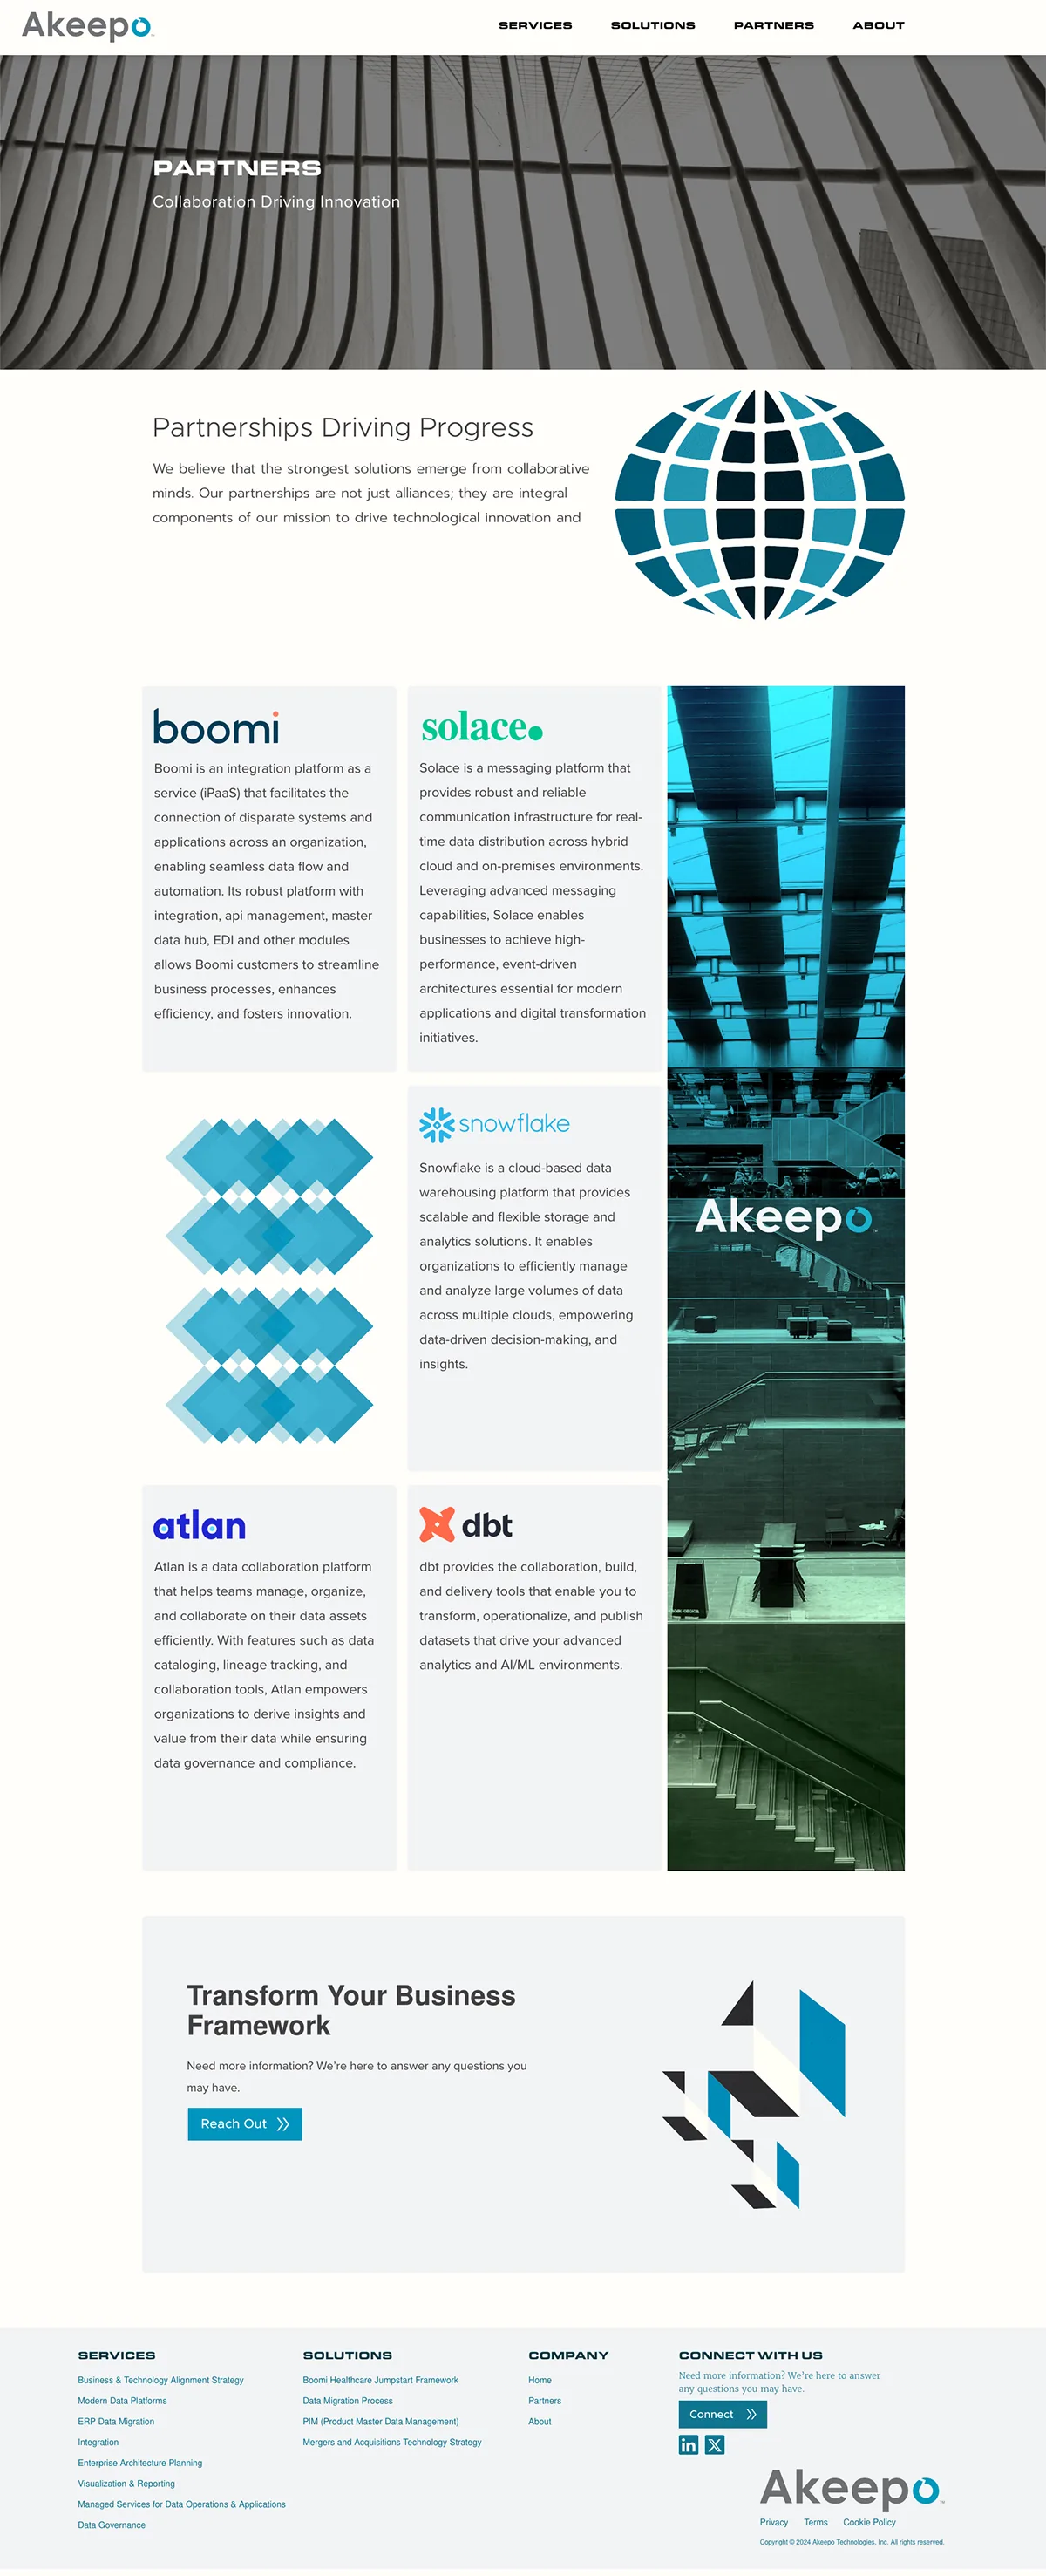
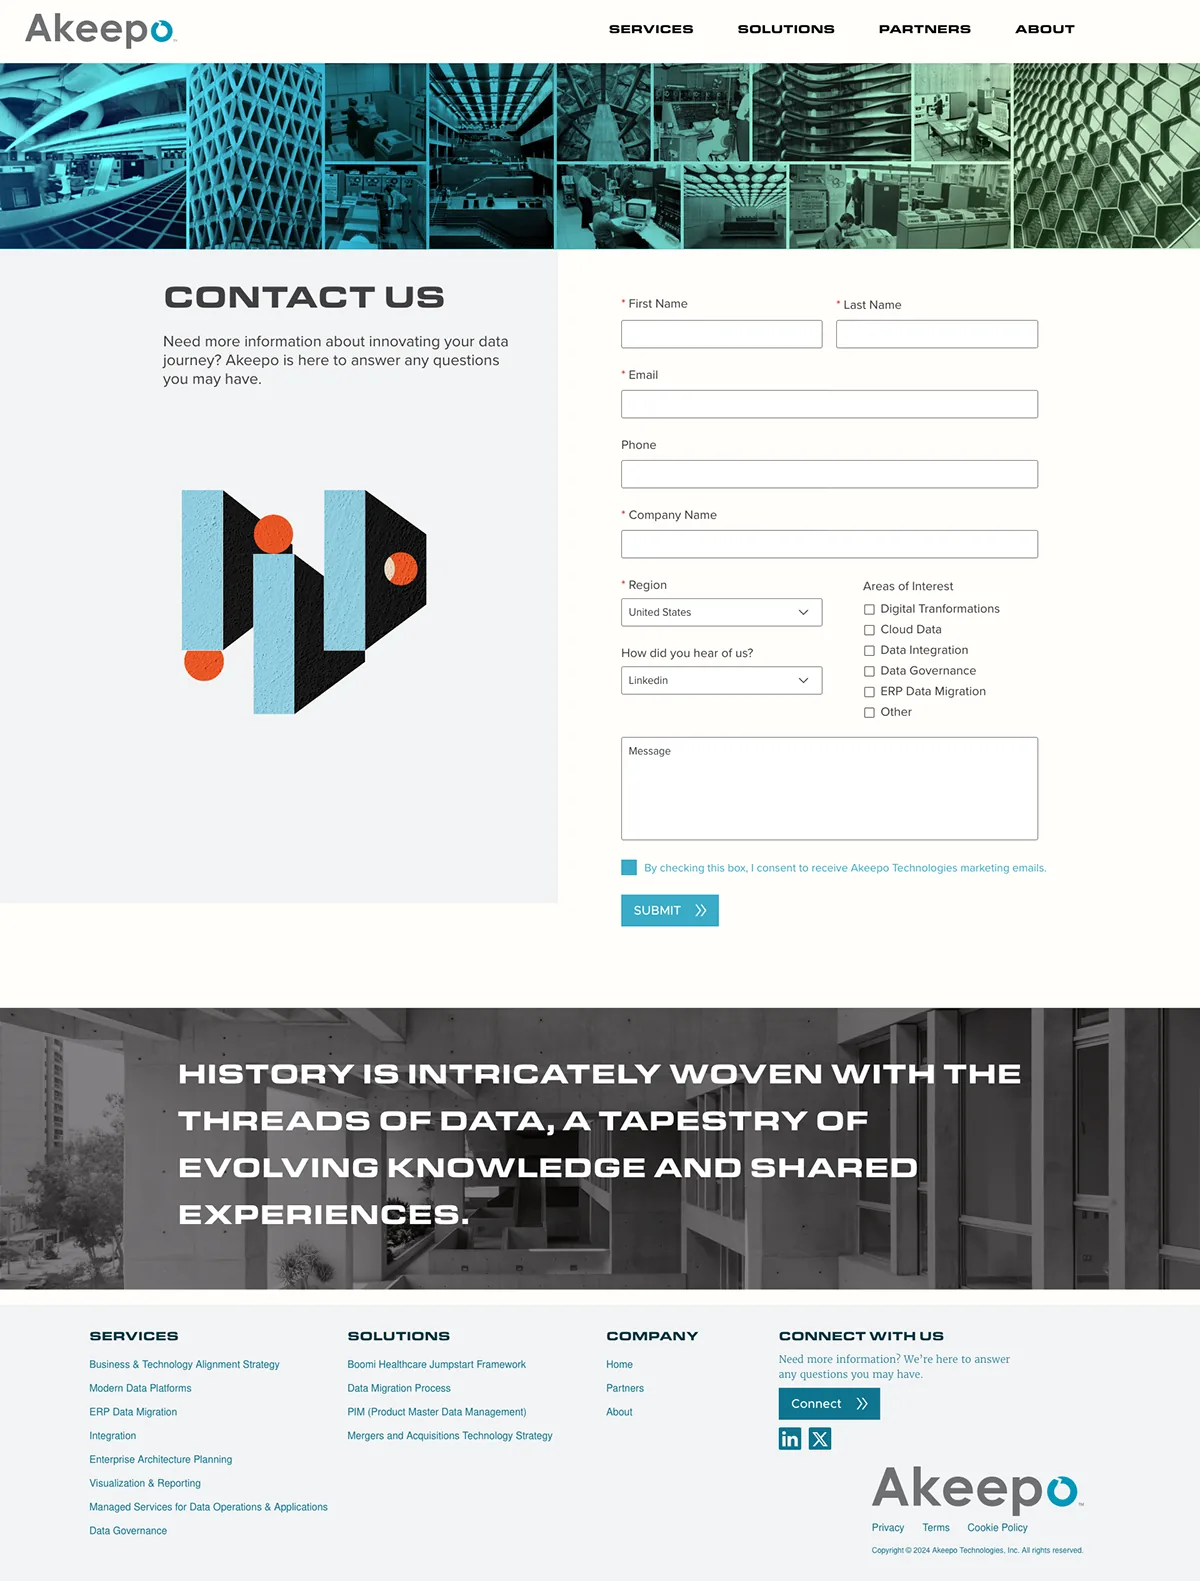
Identity, design system, marketing site
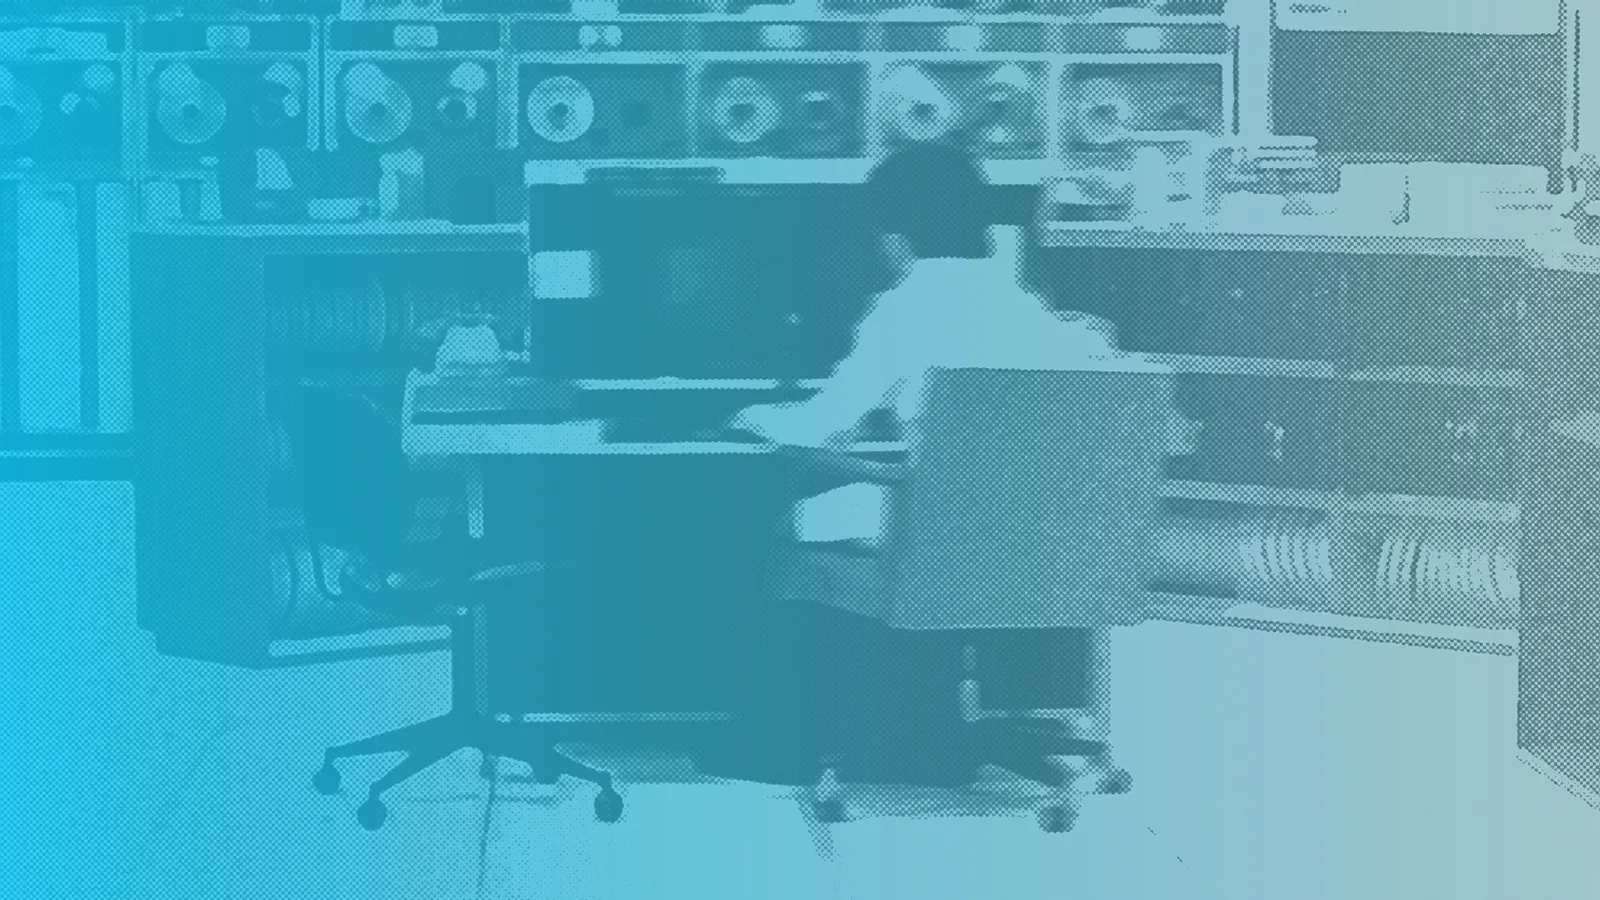
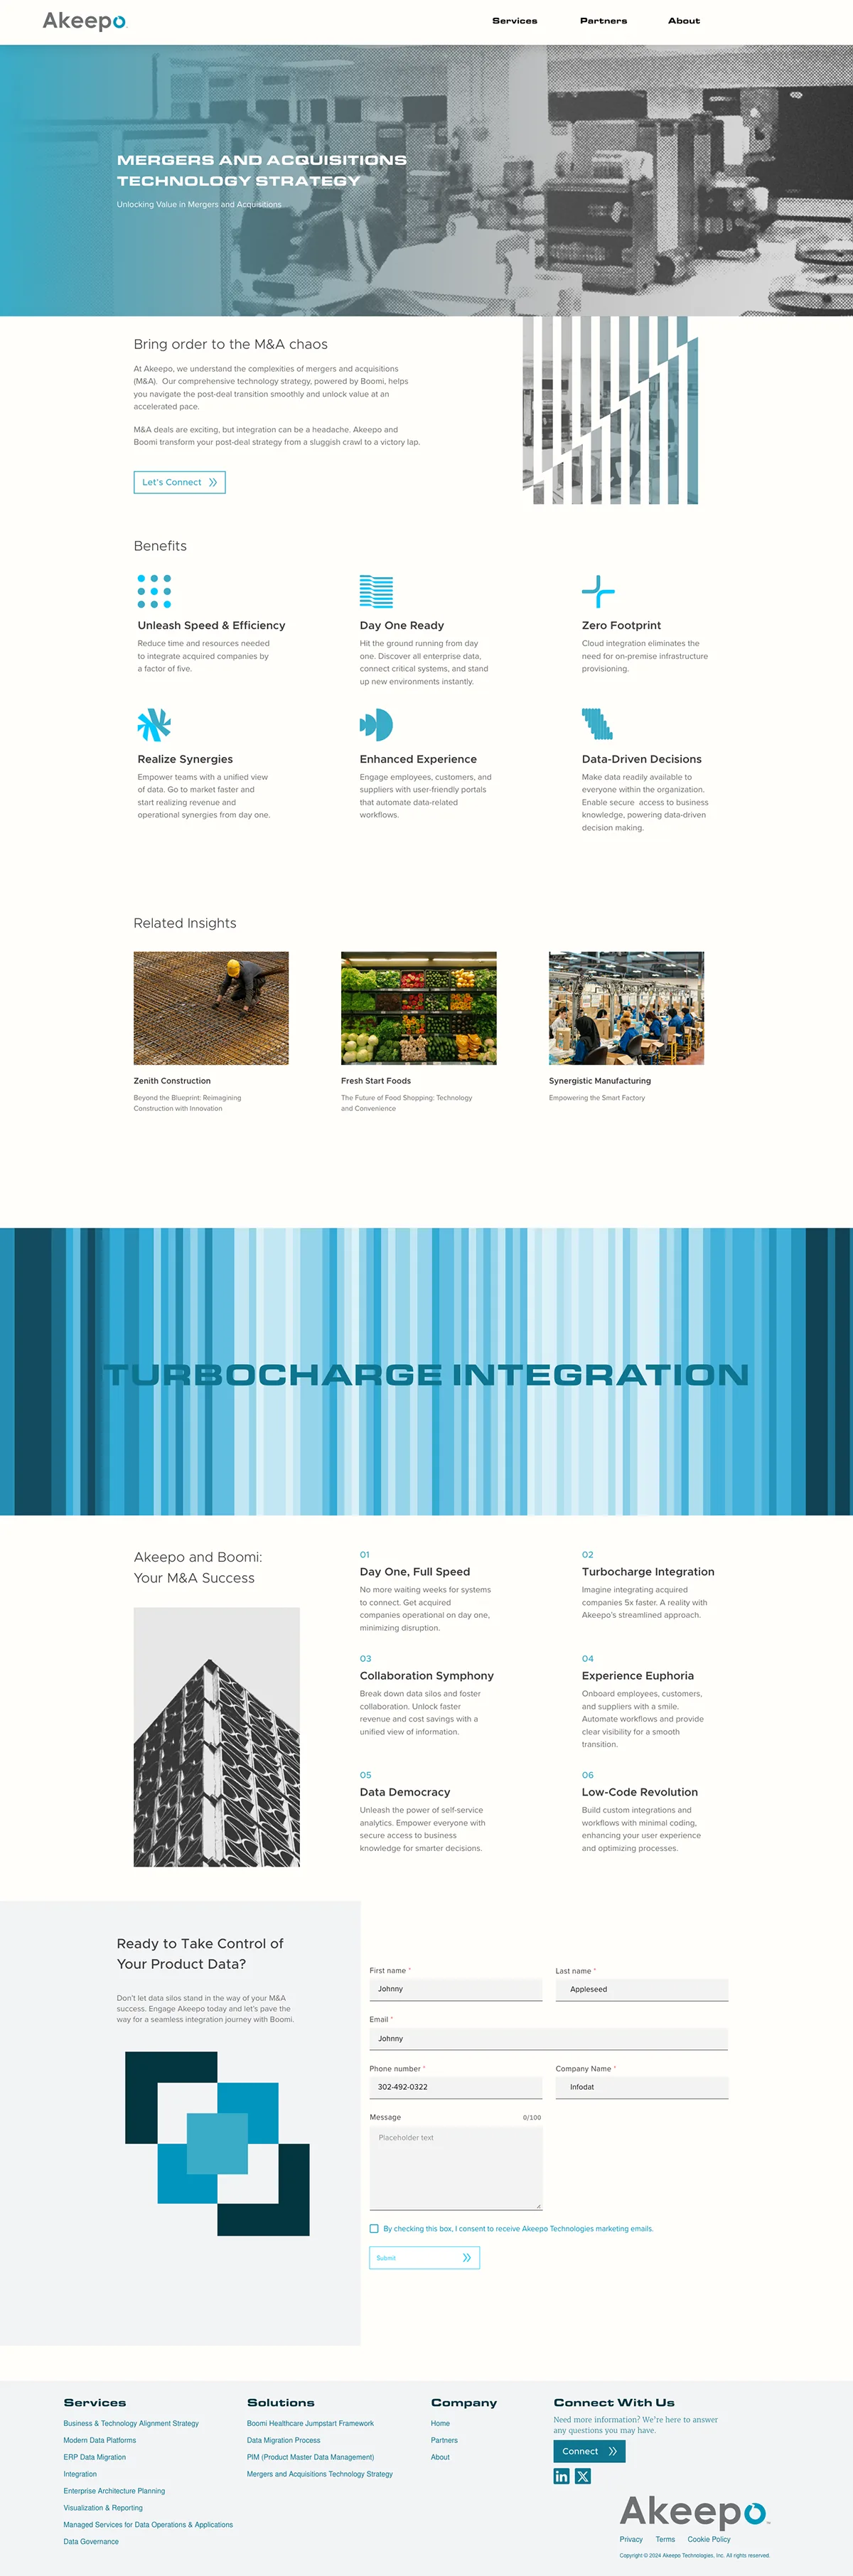
The key visual: vintage computing, washed in the Akeepo palette.
The brief
A brand that could scale
A young company needed a distinctive identity and a system that would hold up as it grew.
The direction
Retro-futurist
Inspired by 1960s and 70s computing and Brutalist architecture: blues, greens, oranges and purples, bold geometric shapes and grids, and vintage terminals.
The result
Heritage meets innovation
A memorable look that presents Akeepo as a tech company that values both where computing came from and where it's going.
What I delivered
Brand identityLogo, palette, type and imagery direction.
Design systemInformation architecture, a reusable component library, and a style guide for typography, color, spacing and imagery.
Marketing siteDesigned and structured the company website.
Brand rolloutLanding pages, social graphics and email templates.
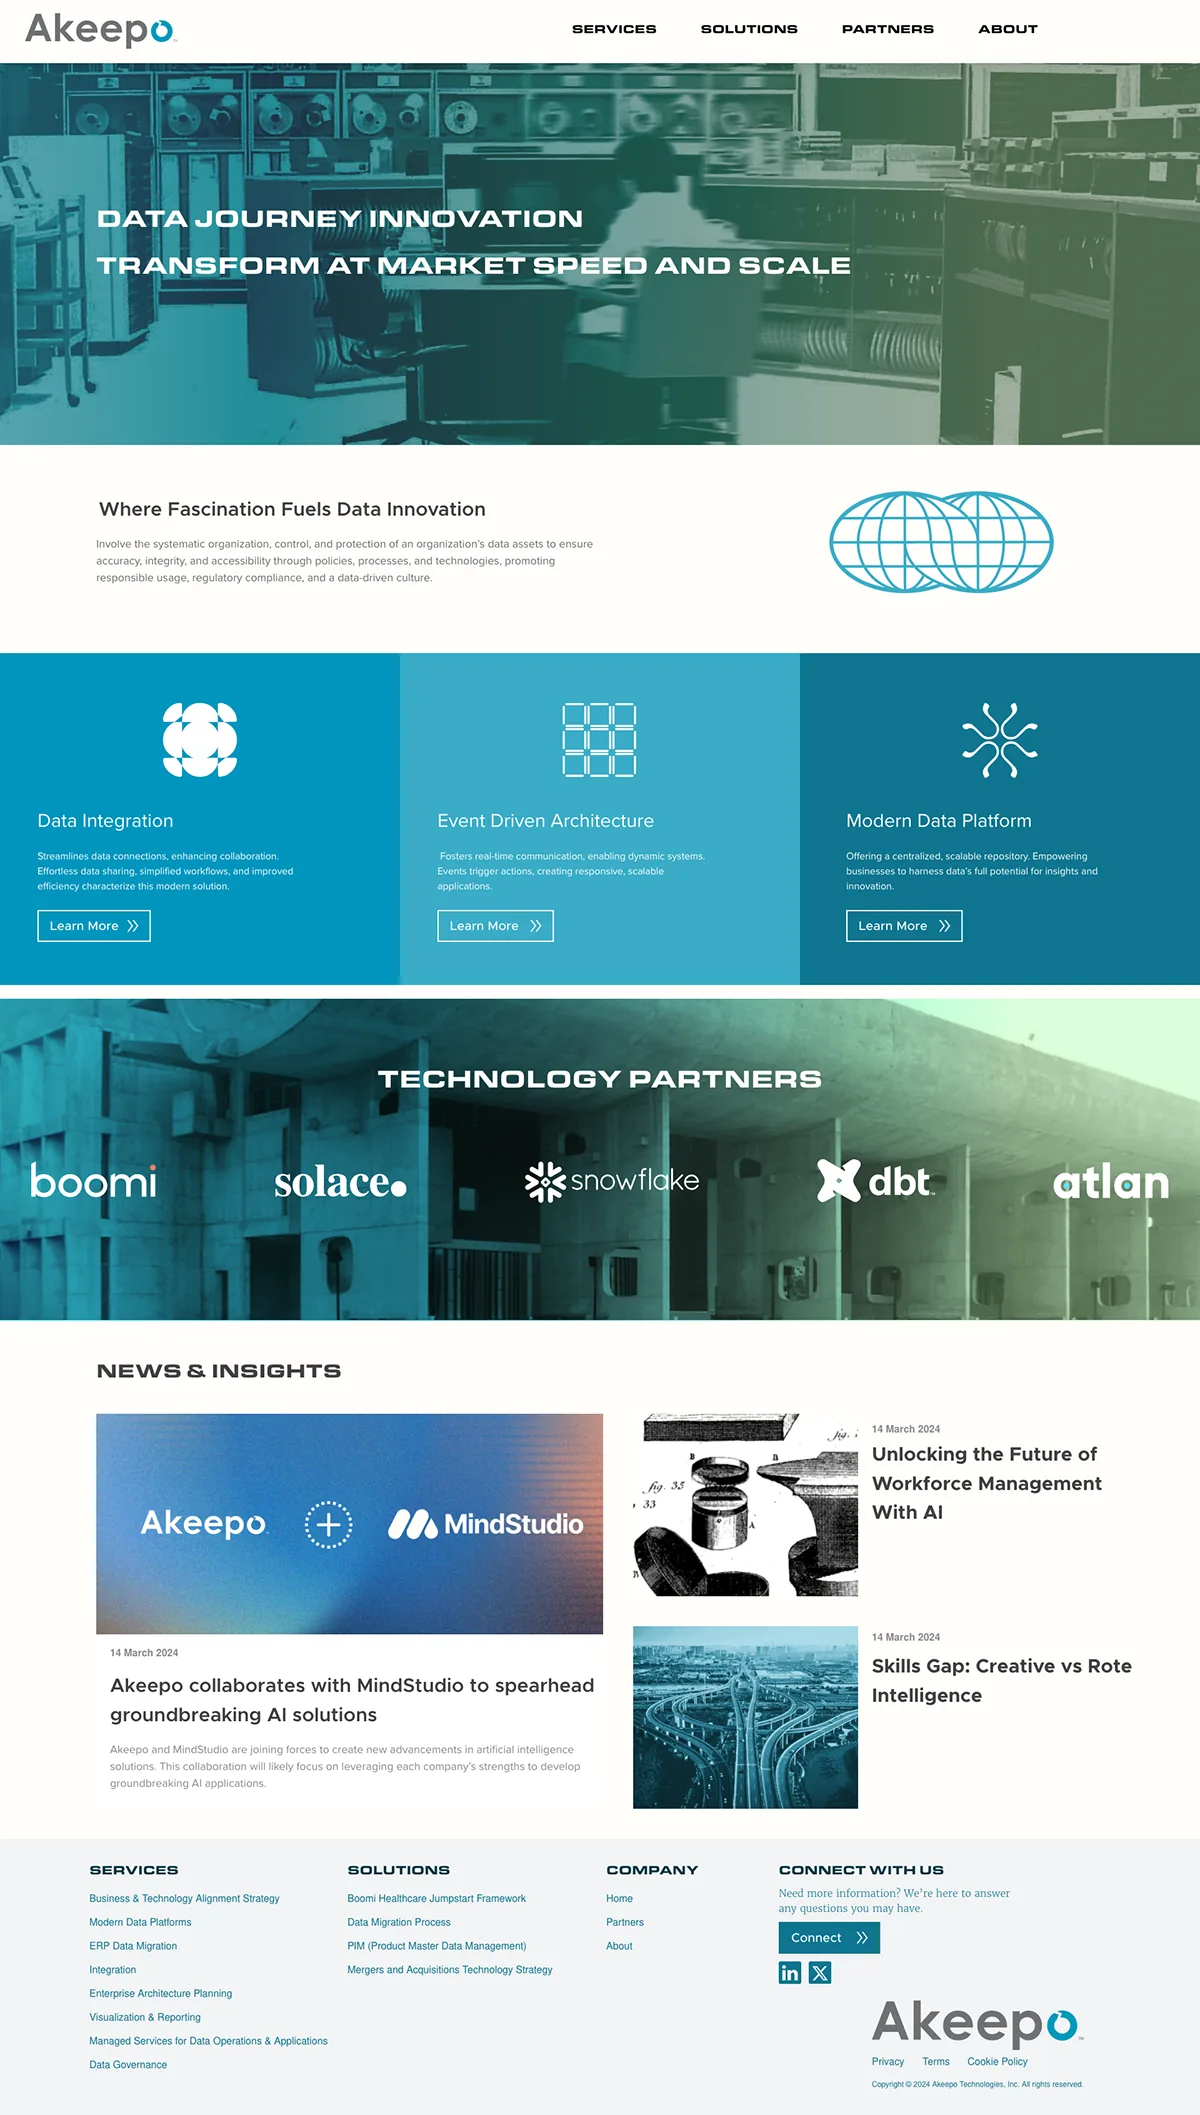
The website
HomeServicesPartnersContactImagery: Brutalist architecture in duotone
Chris Morales / BetBtr
BetBtr
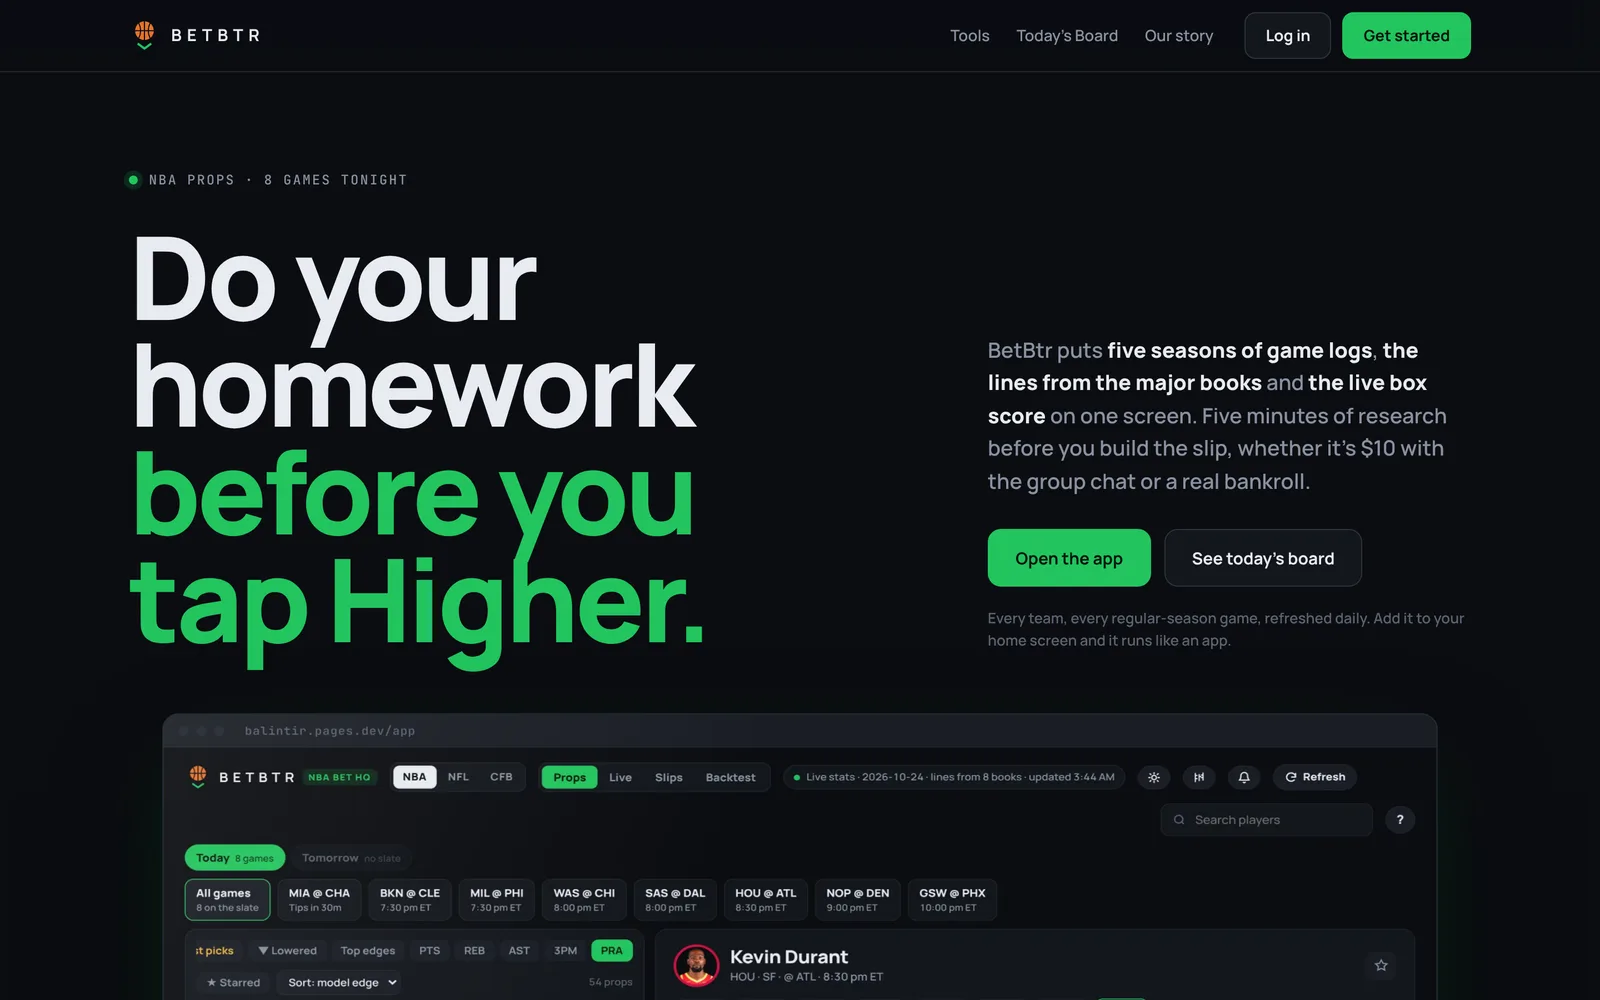
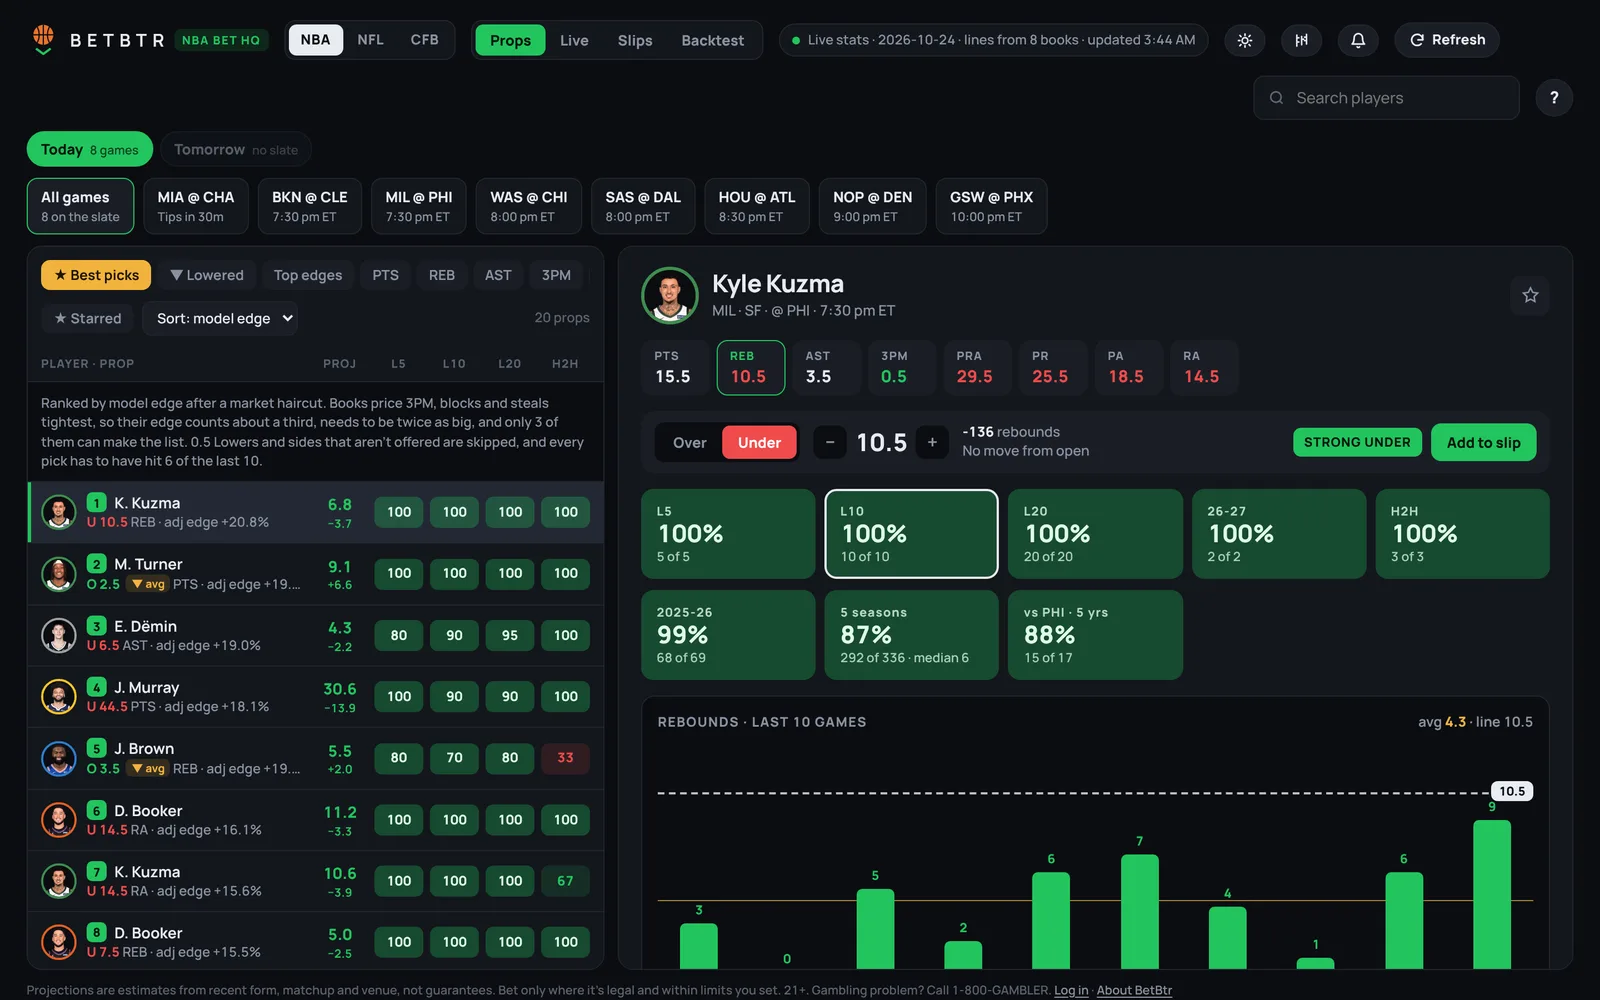
A research app for NBA player props. Its main workspace, NBA Bet HQ, puts five seasons of game logs, lines from the major sportsbooks and the live box score on one screen, so a bettor can check a prop in minutes instead of going on a hunch.
Role
Product designer and builder
Built with
Claude, as a design and code partner
Year
2026
Scope
Product, UX/UI, data visualization, landing page, mobile
The landing page sets the promise: do your homework before you tap Higher.
The problem
Most people bet props on a feeling. A player hit his last three, the line looks low, the group chat is all over it. That sometimes works for a night but rarely over a season. The numbers that would settle it are spread across box scores, injury reports and ten sportsbooks, and nobody with a job has an hour before tip-off to pull them together.
Who it's for
People who would rather check first: college students stretching a small bankroll, and people with jobs who have five minutes, not fifty. They know the players but not the math, so the app has to do the math and show its work in plain language.
Design principles
Show the work
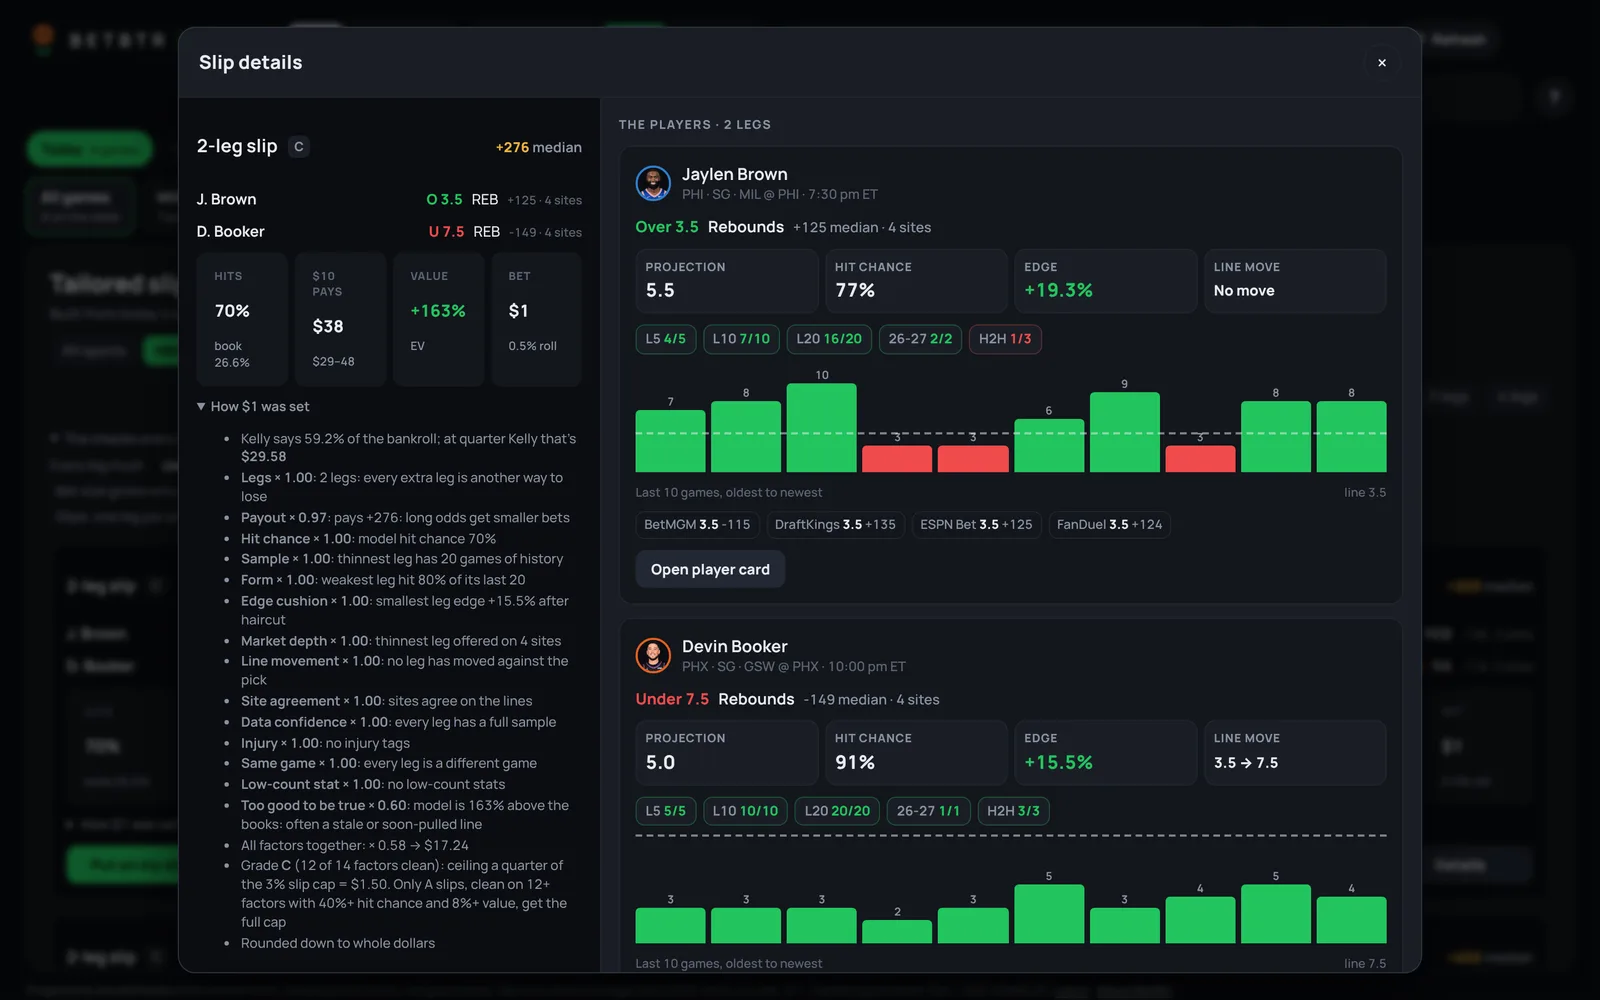
Every pick traces back to hit rates, a projection and line movement. Slip details list each factor that set the stake, down to the dollar.
One visual language
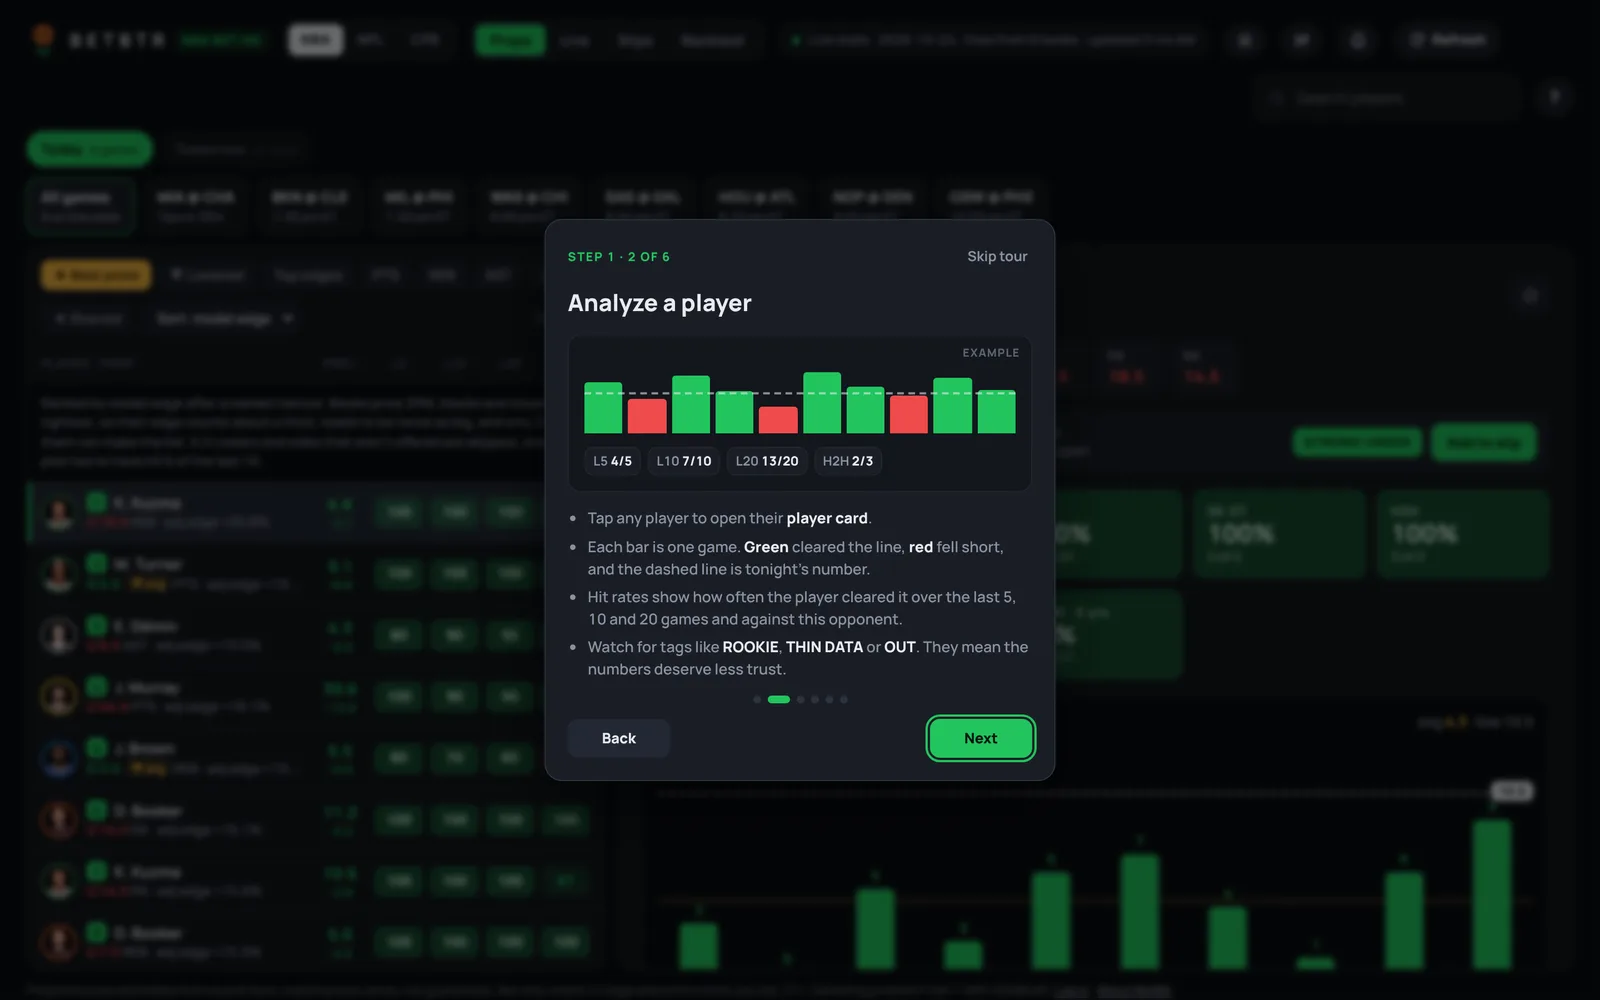
Green cleared the line, red fell short, and the dashed line is tonight's number. Every chart, chip and tile follows that rule.
Cautious by default
Edges take a market haircut, stakes use quarter Kelly, and picks that look too good get marked down. ROOKIE, THIN DATA and OUT tags flag weak numbers.
Responsible by design
Per-slip and per-day caps, 21+ and 1-800-GAMBLER on every screen, and copy that never promises a win.
The tools
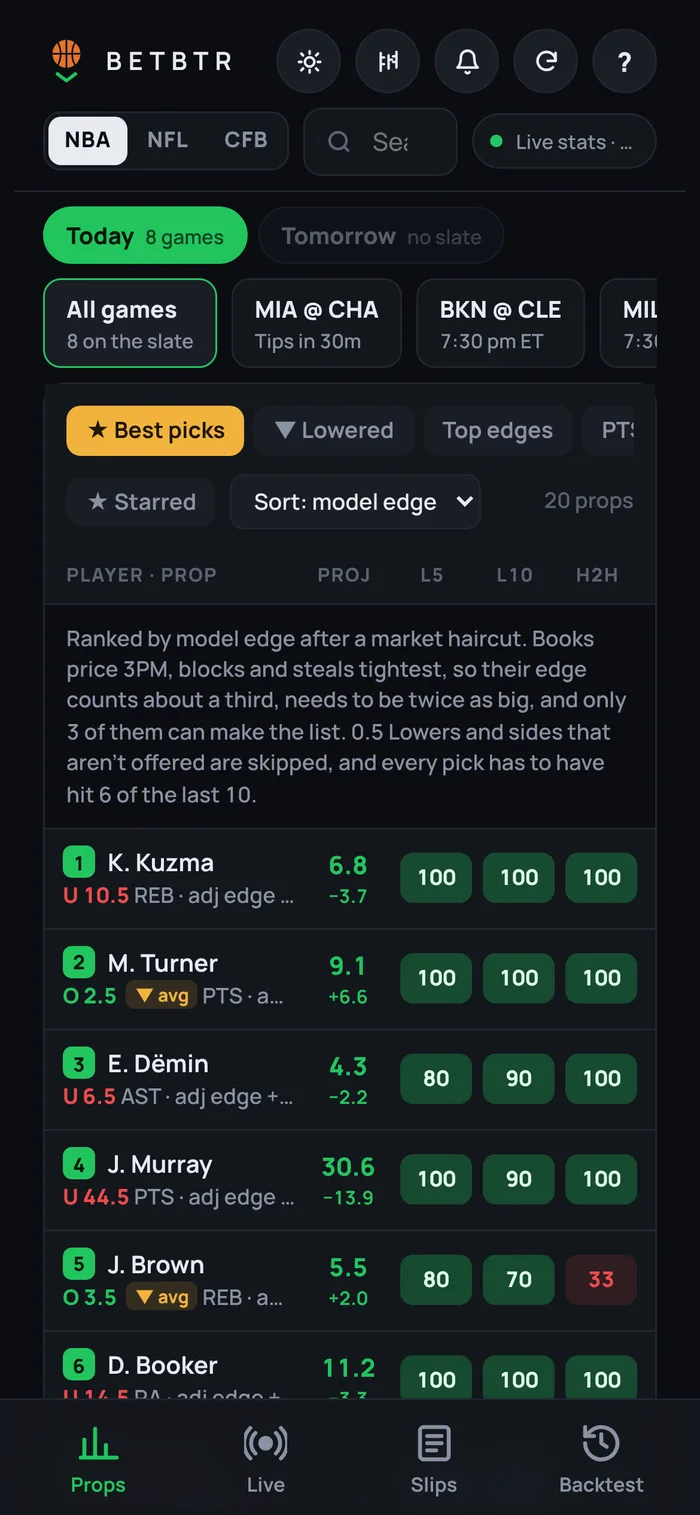
Best picksReads the whole slate and ranks the props worth a look. A side has to have hit 6 of its last 10 to make the list.
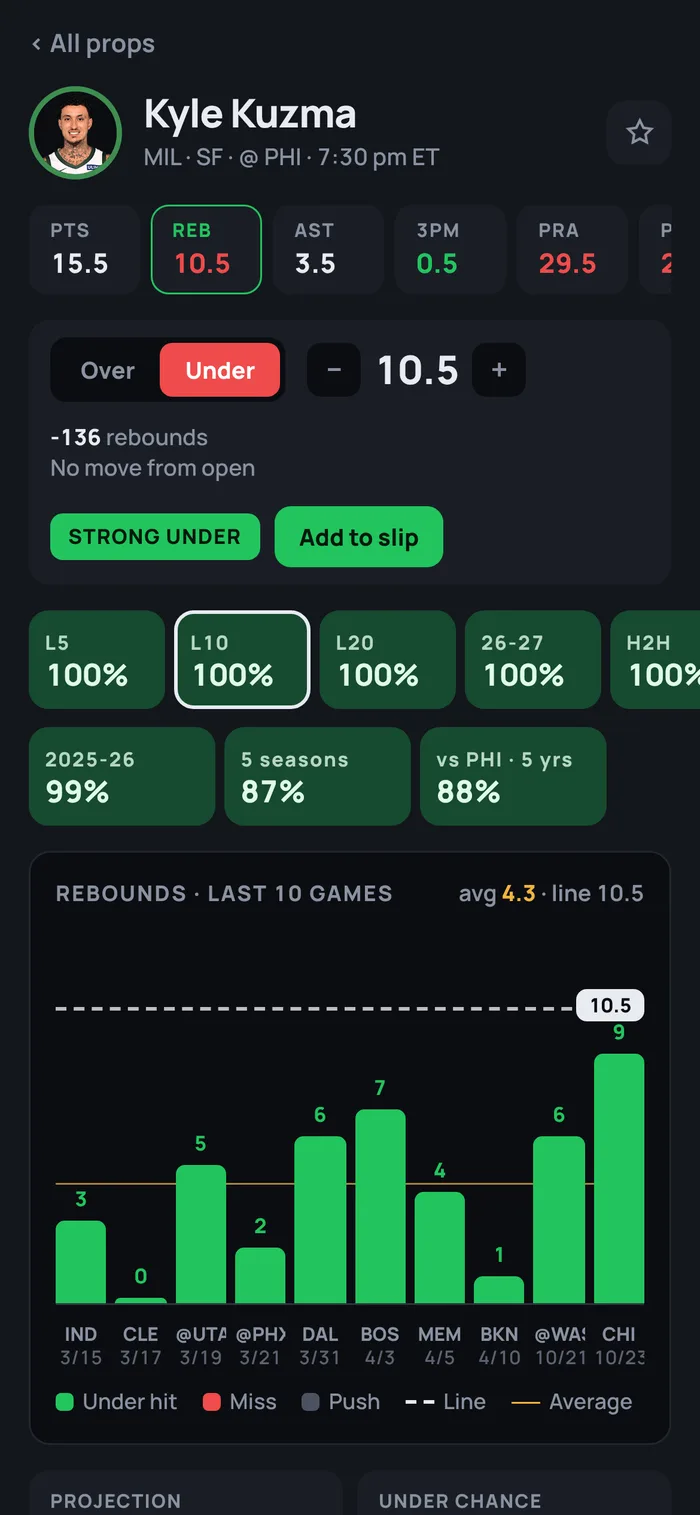
Player cardsLast 5, 10 and 20 games, this season, five seasons and head-to-head, with the last ten games charted against the line.
Tailored slipsBuilds parlays from the best picks and ranks them by value, not payout, sized to your bankroll.
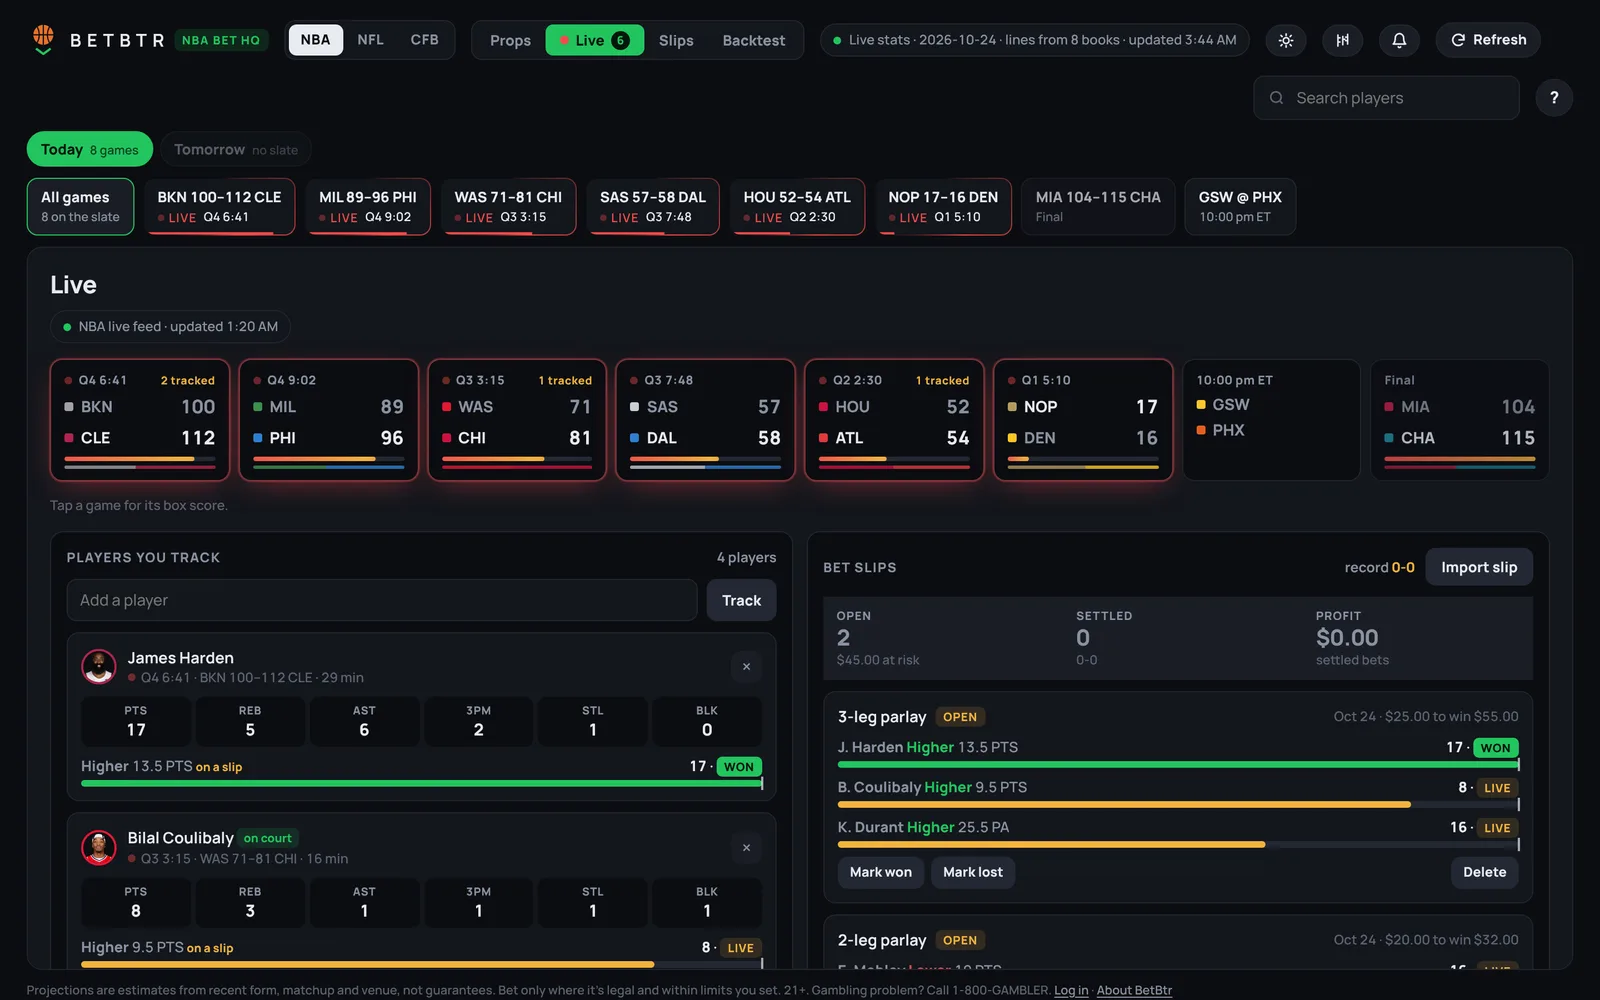
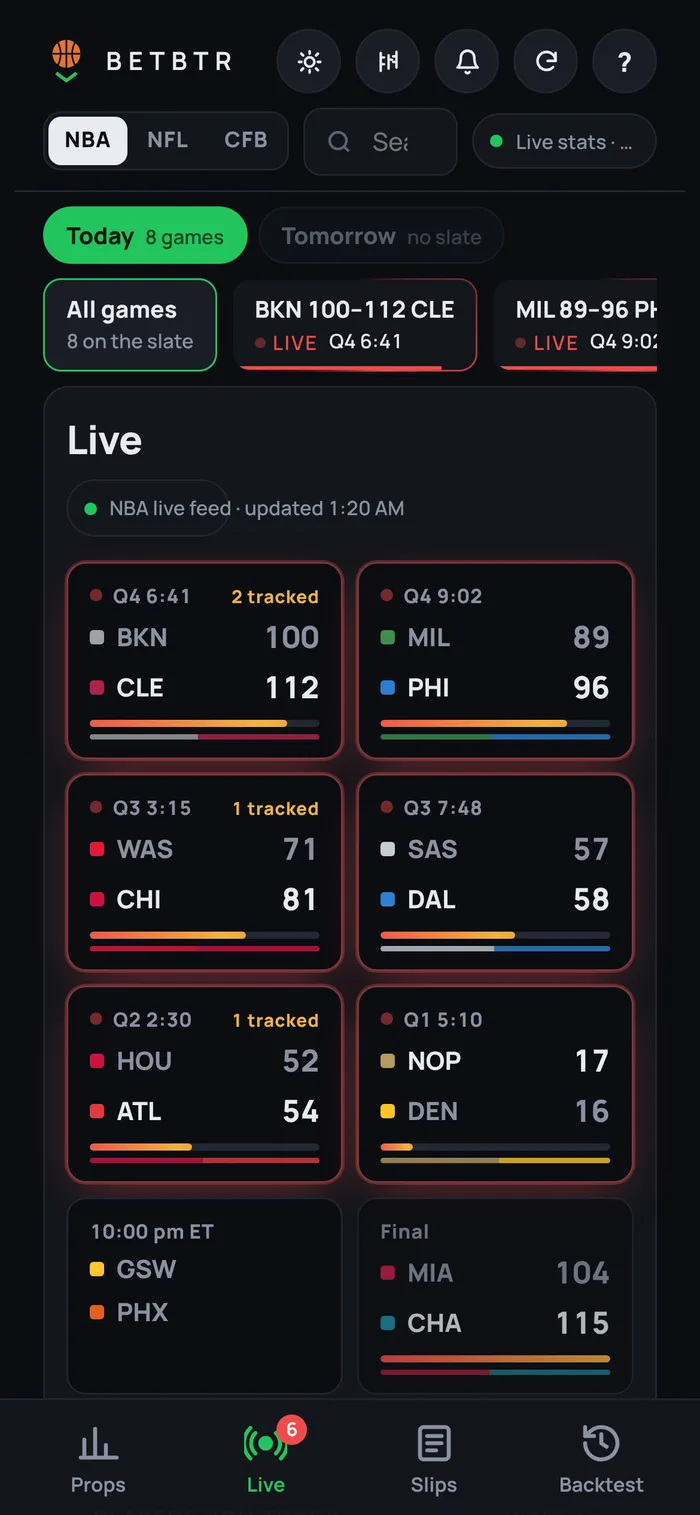
LiveEvery game on the slate in one strip, with each tracked leg's progress toward its line.
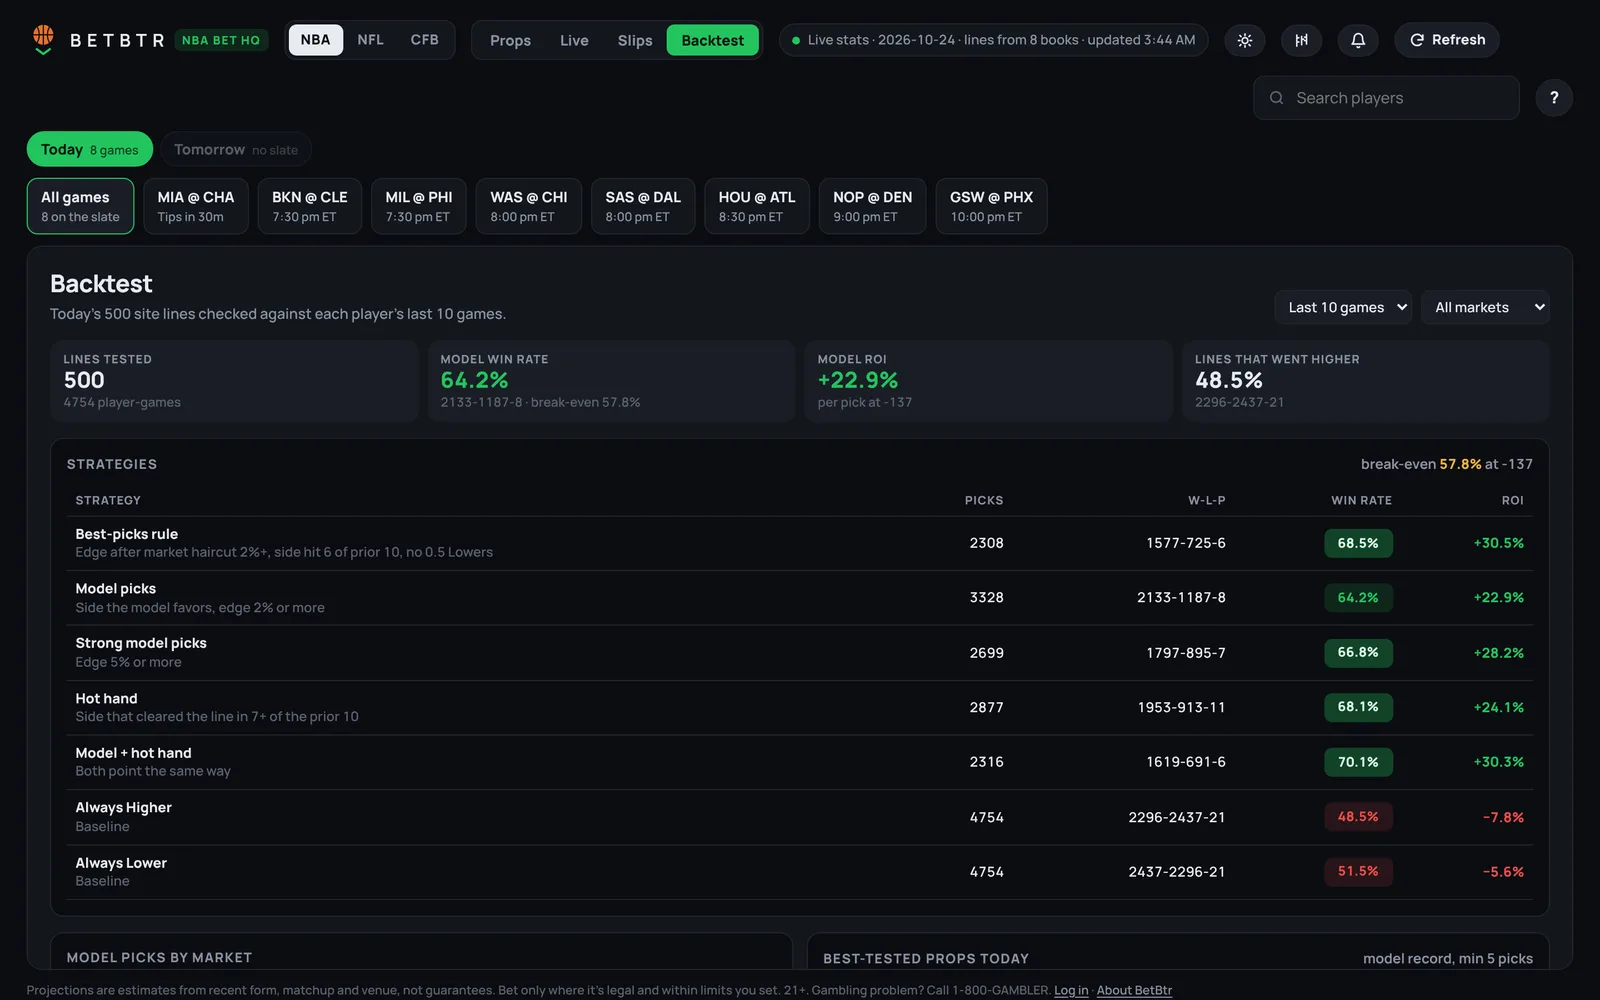
BacktestReplays today's lines against recent games, so a strategy can be tested before money goes on it.
NBA Bet HQ: the ranked board on the left and the player card on the right, so you never lose your place.Slip details explain how the stake was set, one factor at a time.Live: scores, tracked players and every open leg on one screen.Backtest compares strategies against a break-even line, including the naive baselines.A six-step tour teaches the chart once, so every other screen reads without help.
On the phone
Best picksPlayer cardLive
Where it stands
BetBtr is invite-only while it's being finished, with a personal pass key for each member and a free preview of tonight's board for everyone else. On a backtest of 500 of the day's lines against each player's last ten games, model picks hit 64.2% against a 57.8% break-even. That is a check on recent games, not a promise, and the app says so.